
Earth Land Surface Temperature
 Image
ImageRes:
Image:
Low Res Med Res Hi Res 4KSource: NASA Earth Observations
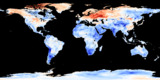
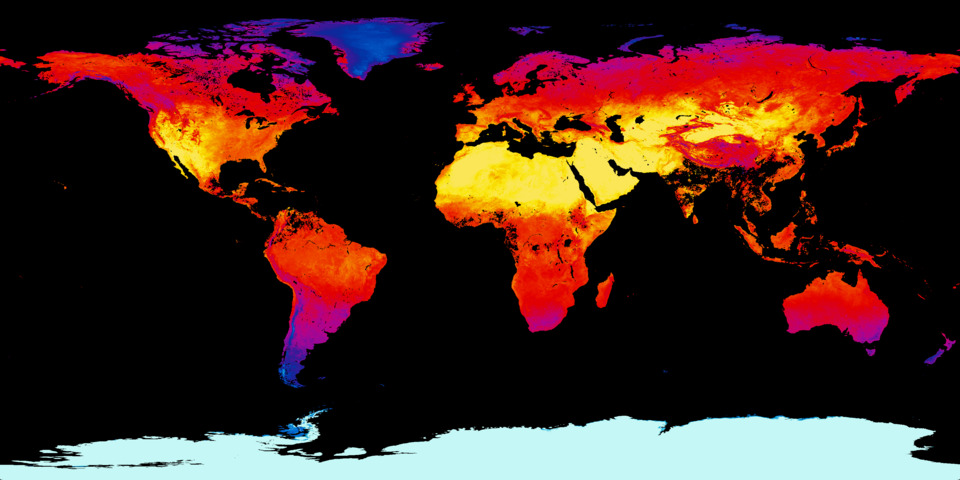
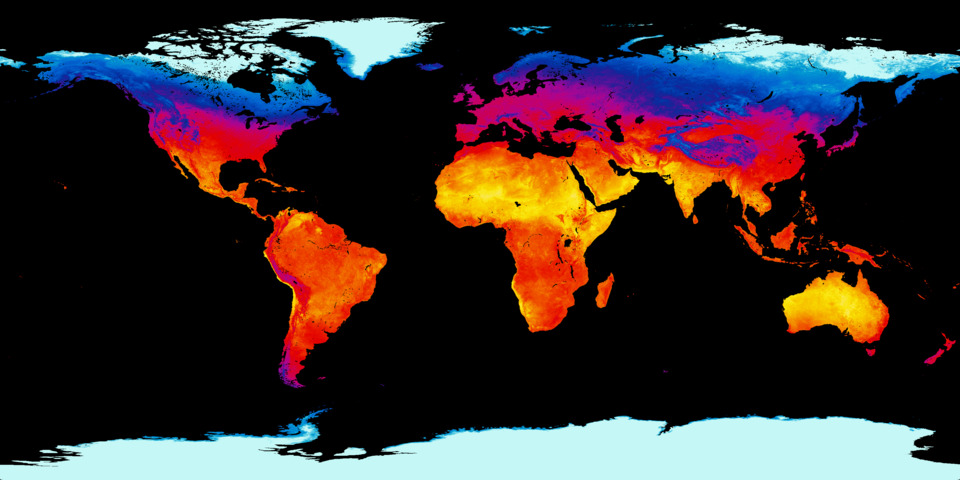
This map shows the average temperature of Earth's land over the last month. You can also see the latest weekly and daily data but they have gaps - it takes a few weeks worth of data to get a complete picture of the whole planet.
The map is created using data from NASA's Terra and Aqua satellites. You can see where these satellite are right now on the orbit tracking pages: Aqua and Terra.
Data source: neo.sci.gsfc.nasa.gov
Related Feeds
More Earth Feeds


Feed Properties
ID: EaLST_LandSurfaceTemp
Type: Image
Updates: Daily
Resources:
Image/Data Usage:
NASA's NEO images are freely available for public use without further permission as long as credit is given. See neo.gsfc.nasa.gov/about/
